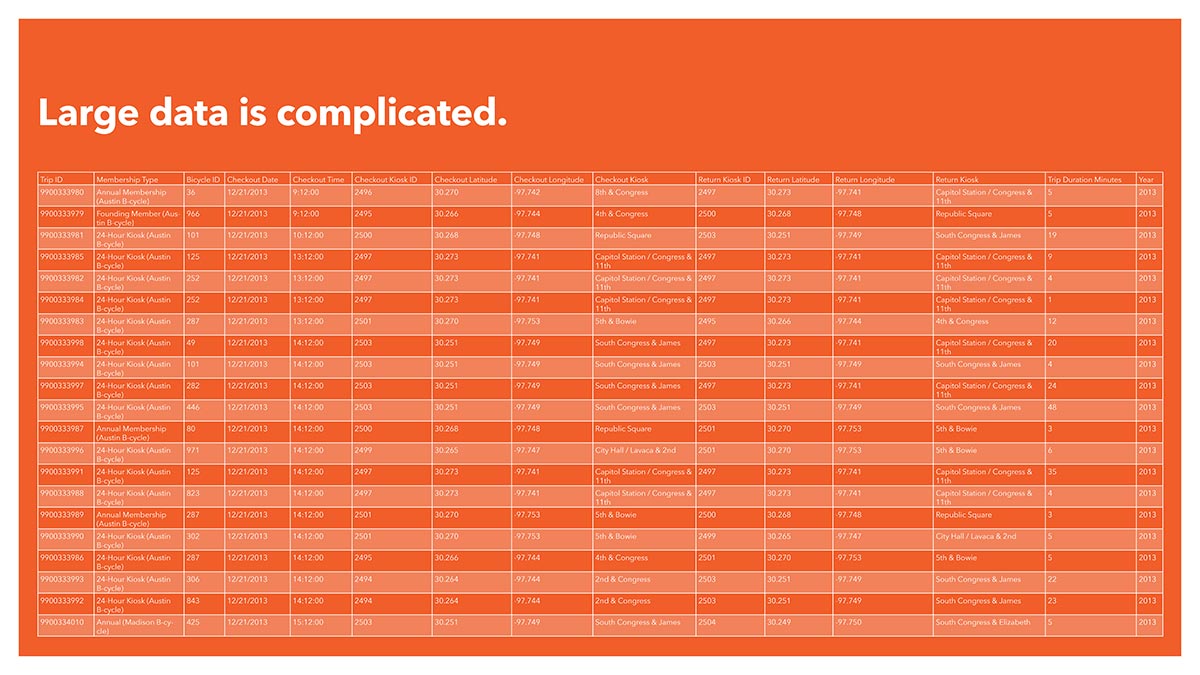
Big Data
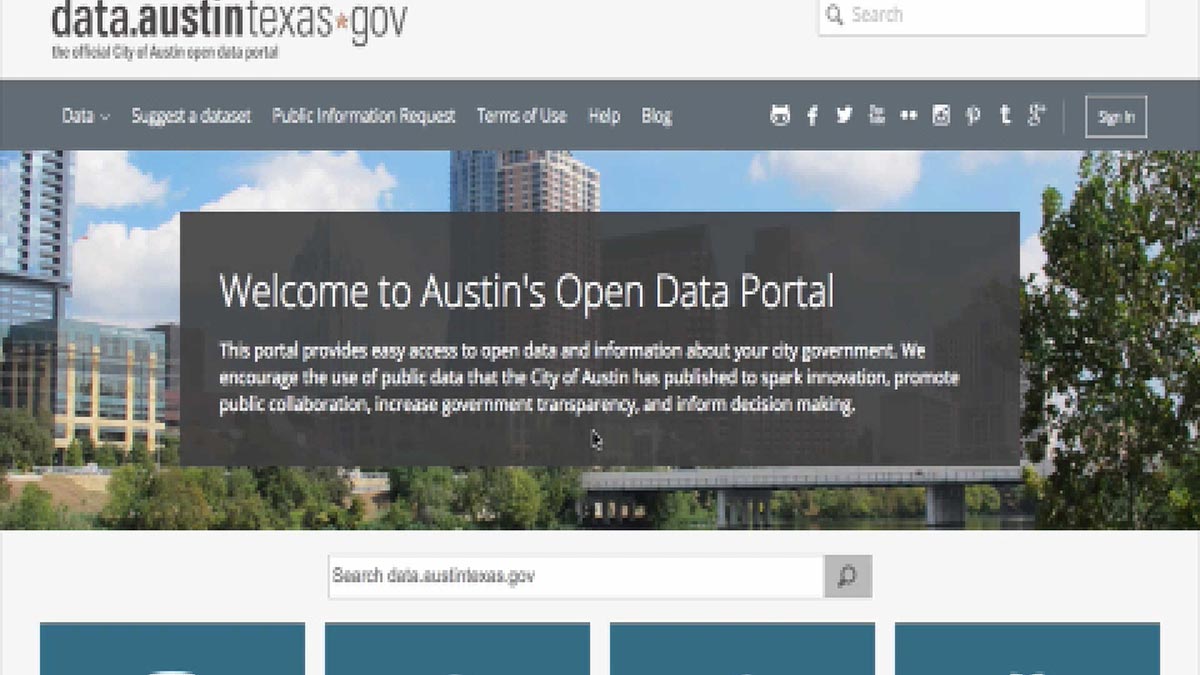
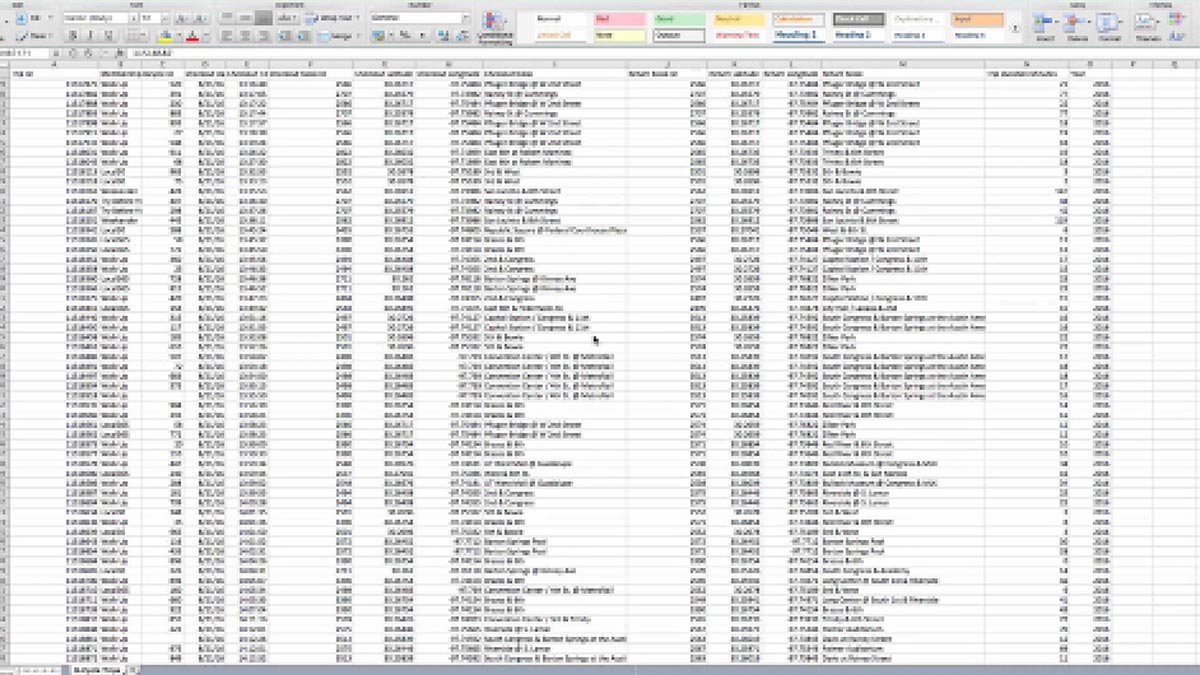
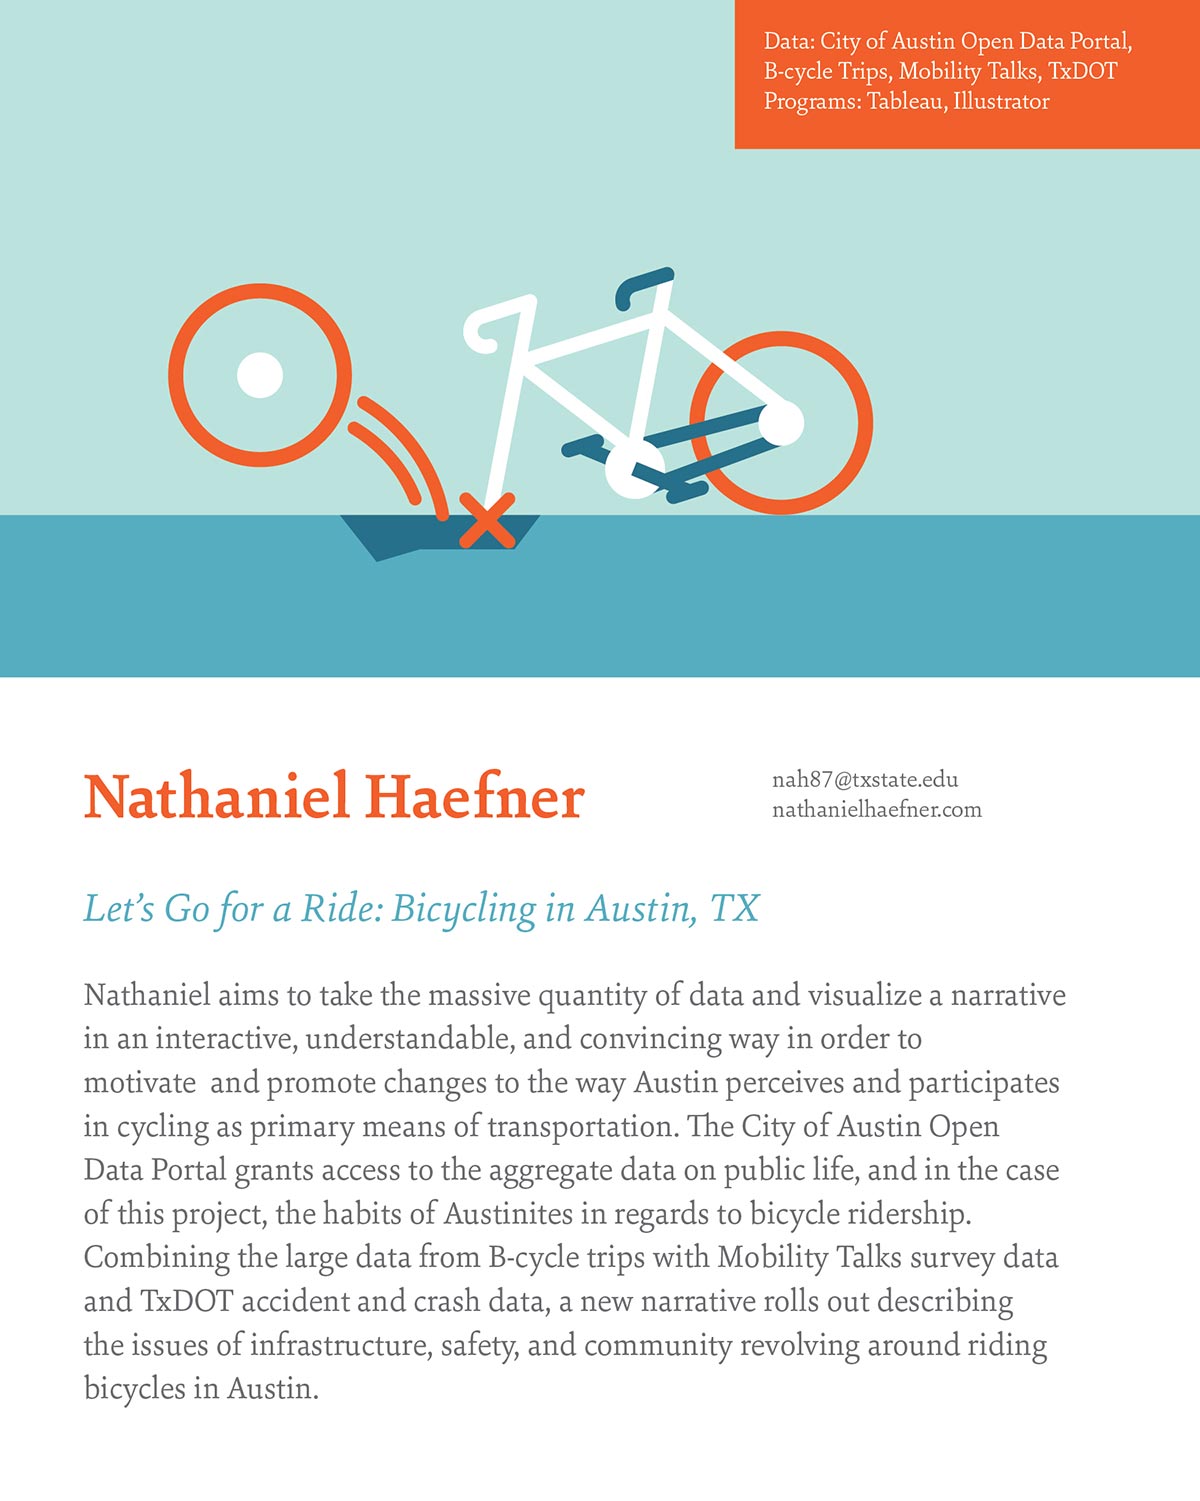
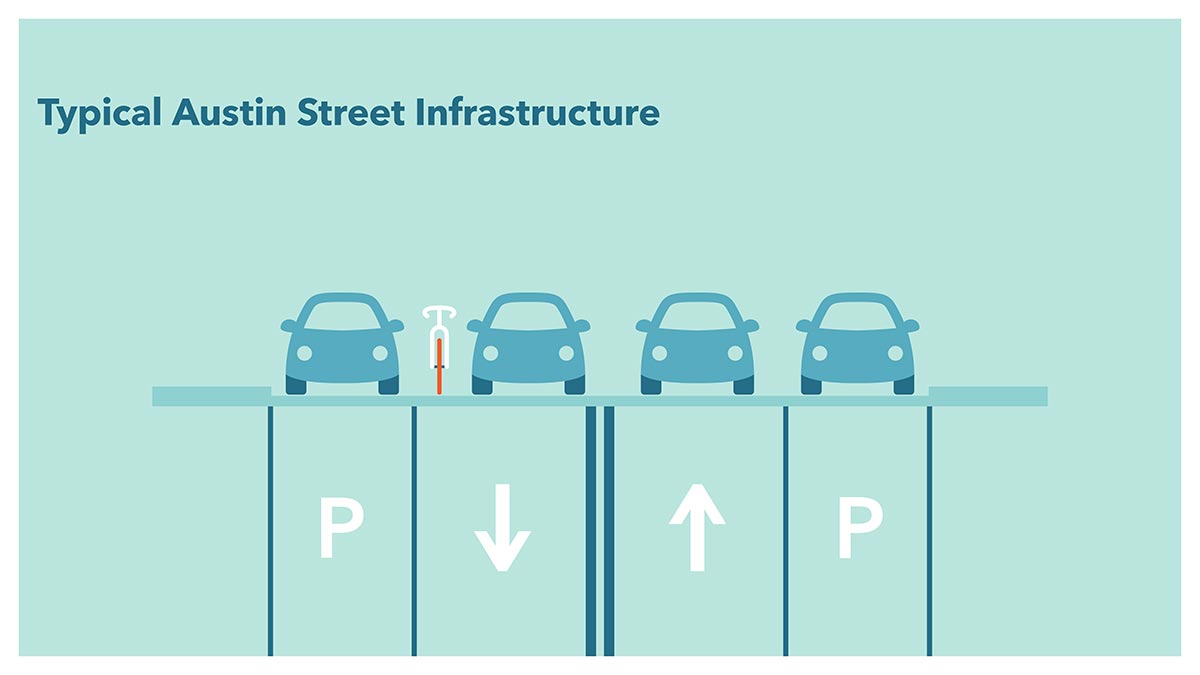
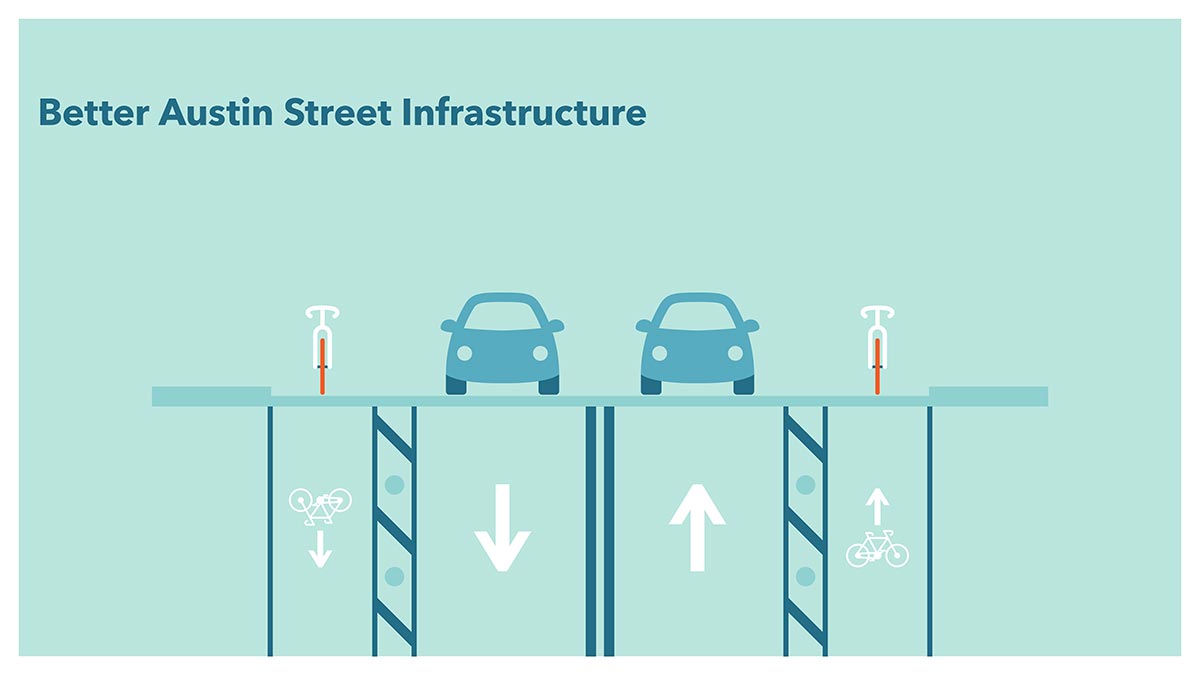
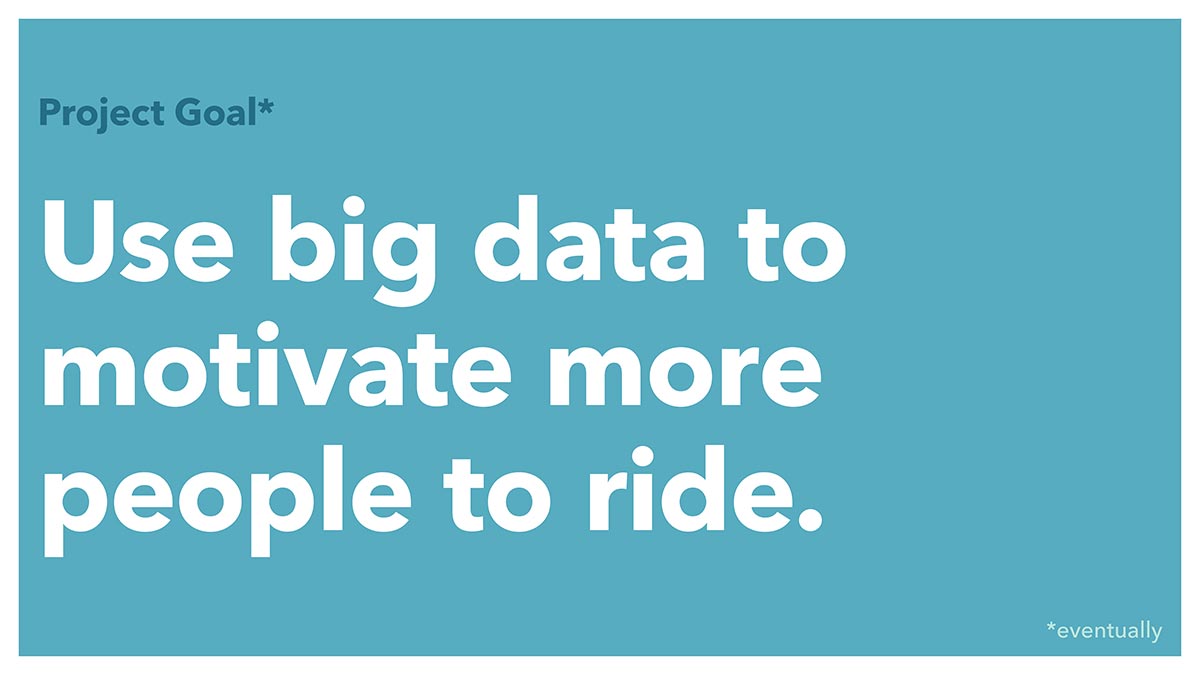
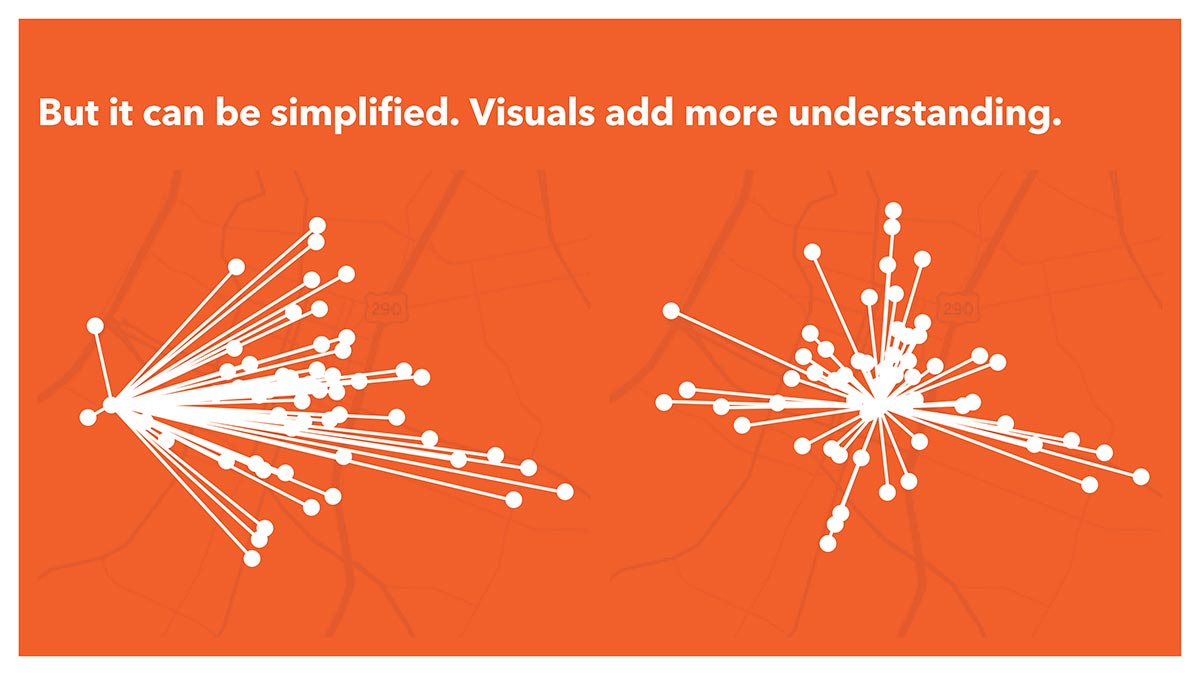
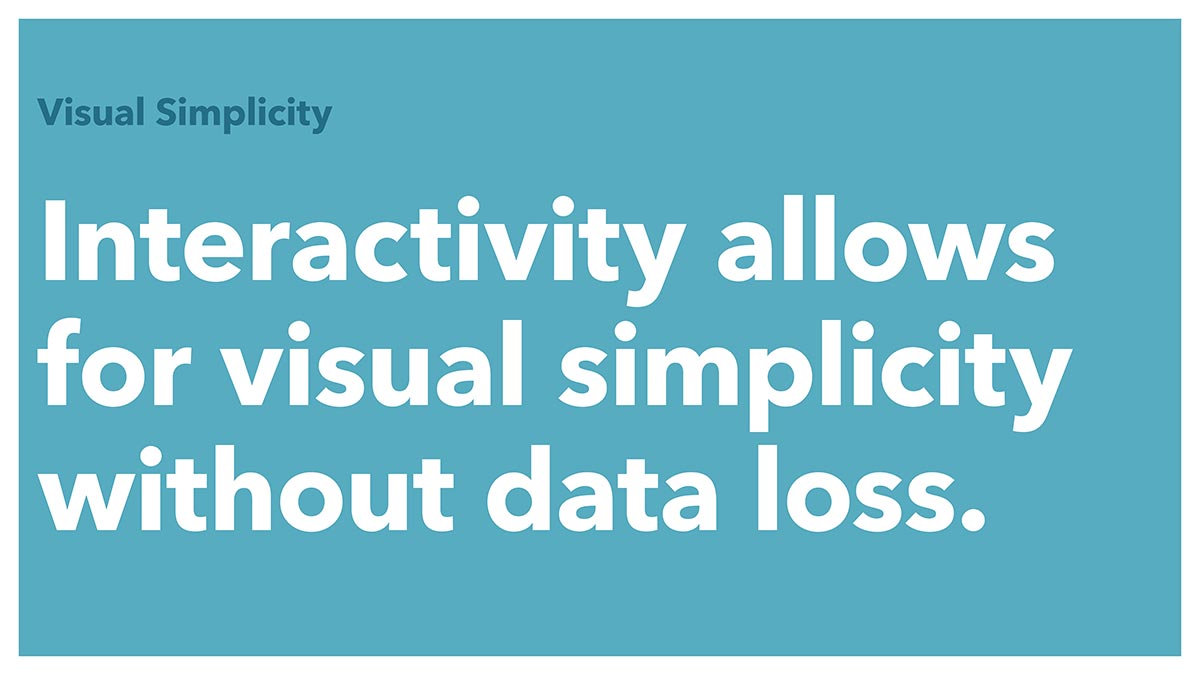
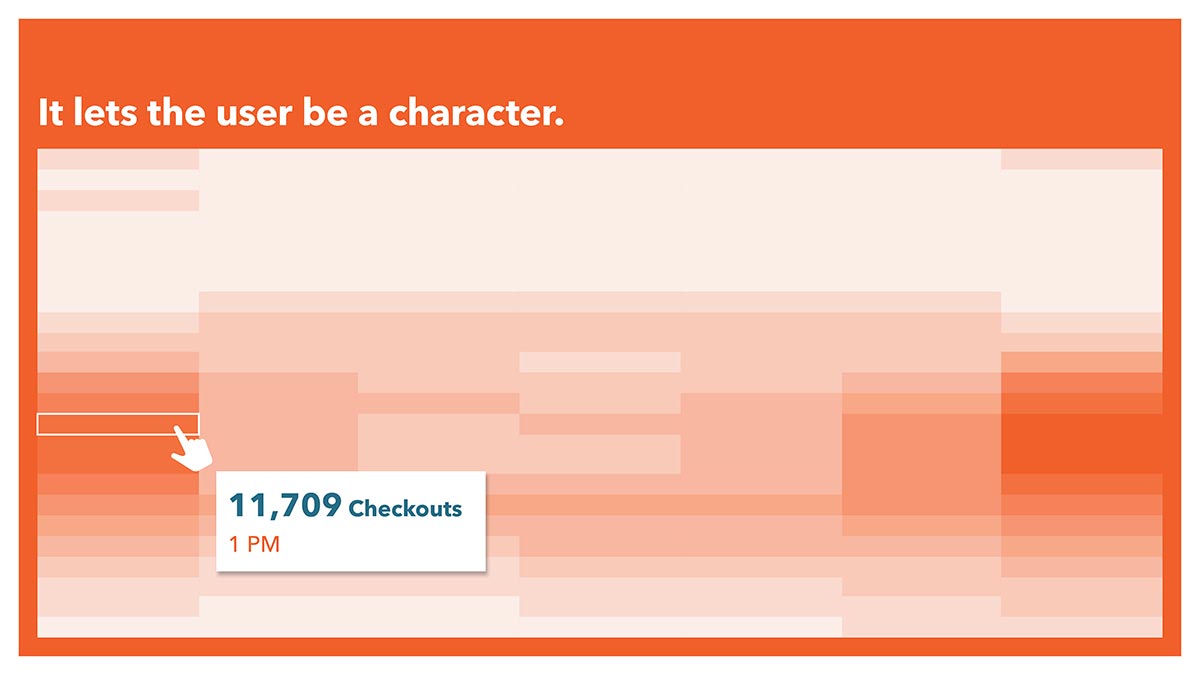
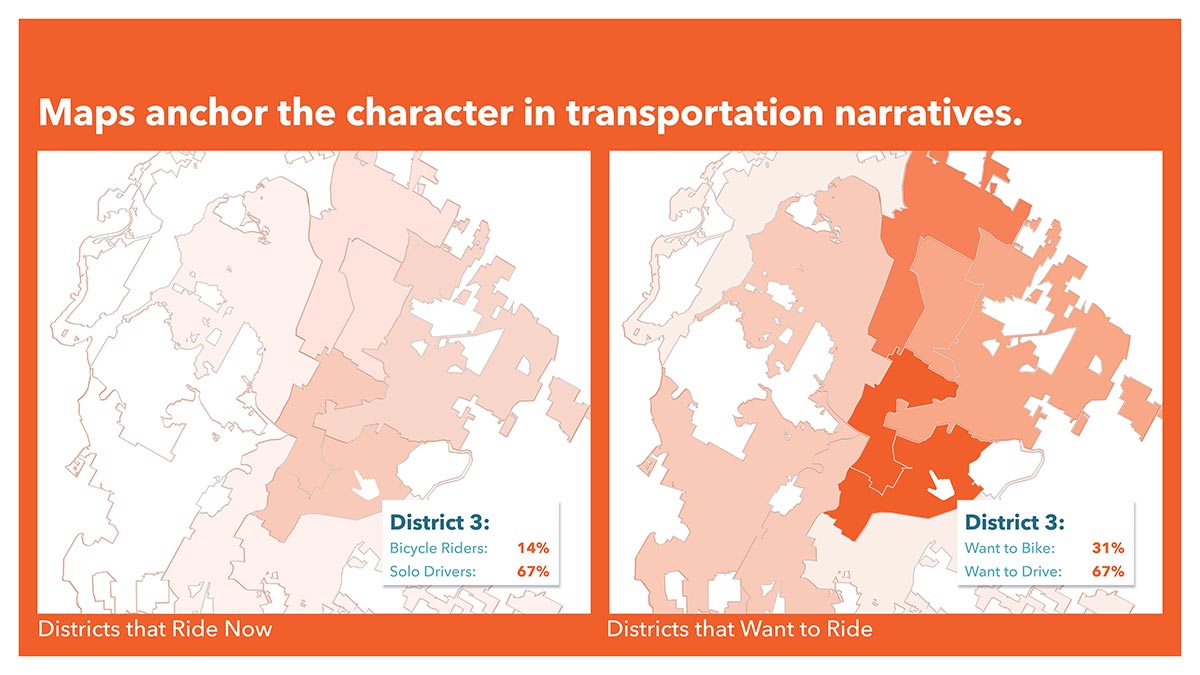
This project aims to take large-scale public data and visually tell a story. Using the Austin Open Data Portal, TxDOT crash reports, and Mobility Talks survey data, a narrative builds the confidence of a potential cyclist to get out and ride around the great city of Austin. Using interactive elements, Users can manipulate and experience the data in an immersive way to make themselves part of the story, empowering a connection with the data that blurs the line between an individual and something greater.
The work was presented at many conferences and workshops following its publishing.
Interactive Visualization
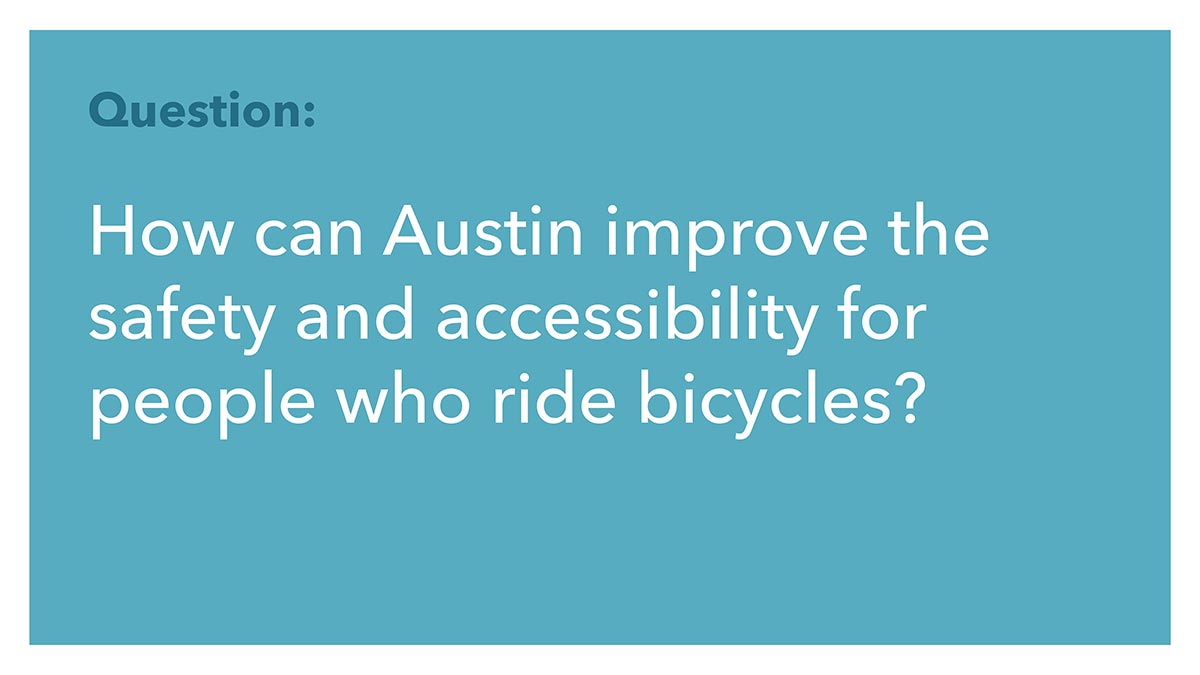
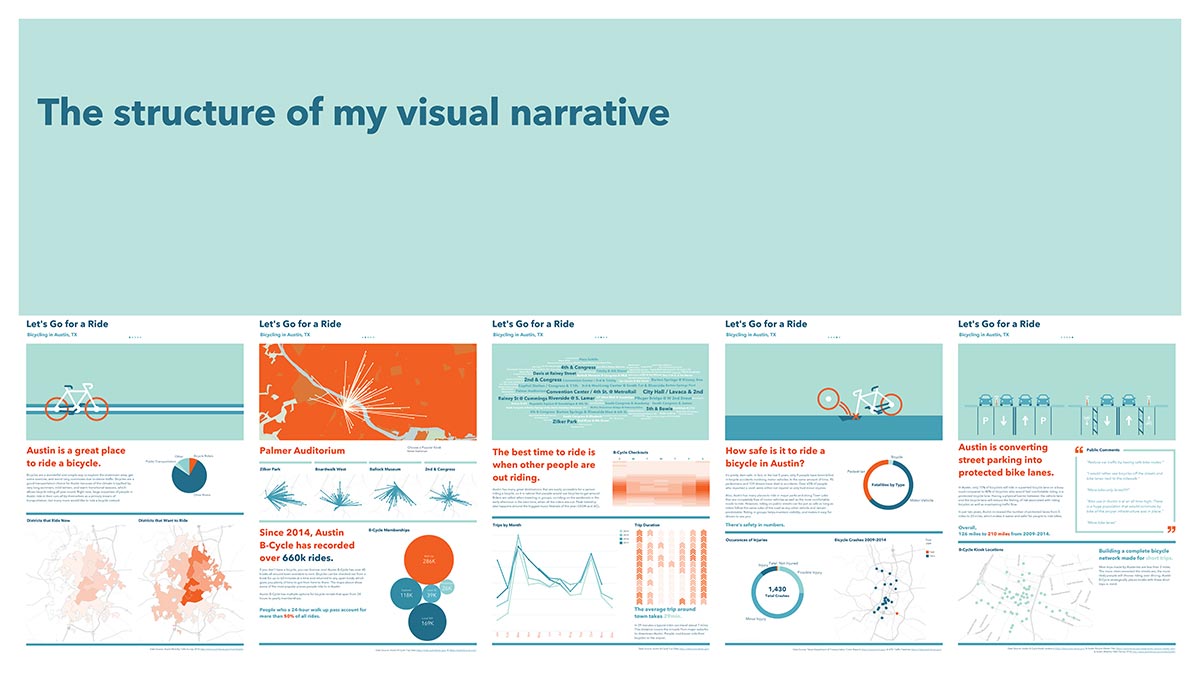
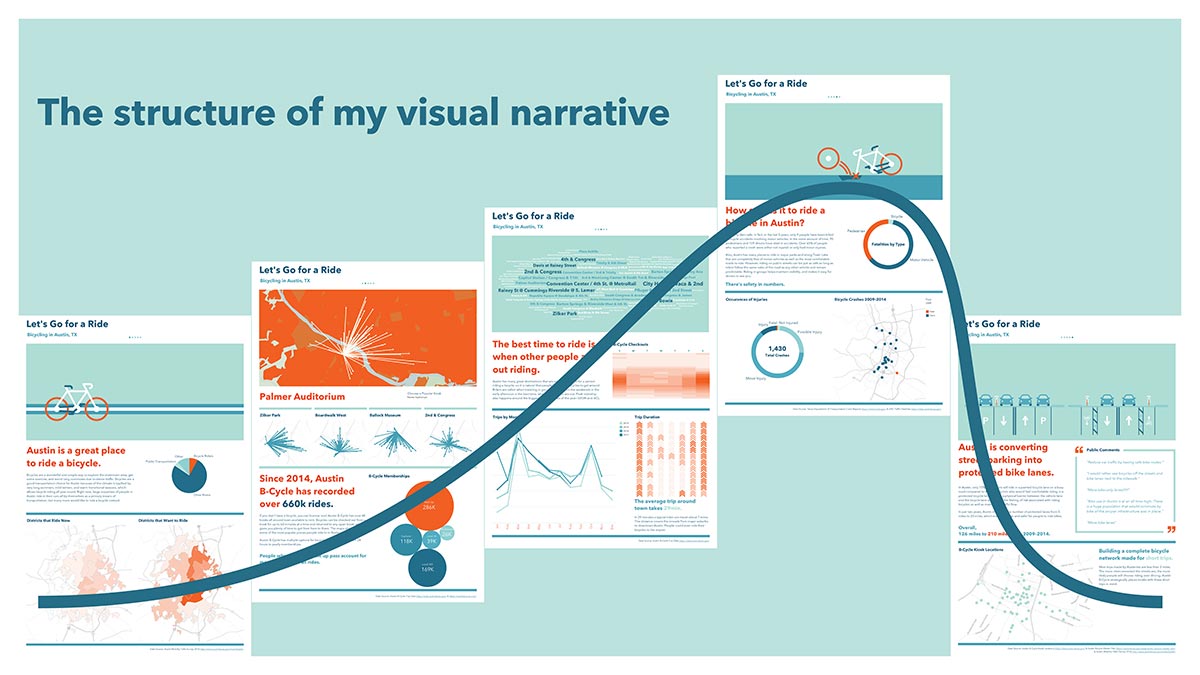
Let’s Go for a Ride is built using Tableau and allows the user to transform and interact with the data to explore how safety and future plans will change the bicycle riding community in Austin. The visualization won 1st place in Tableau's Student Data Visualization contest and was shortlisted in the Information is Beautiful awards in 2018.
View the fully interactive visualization here: public.tableau.com
Austin Design Week
The data visualization was also presented at a workshop for ADW called Understanding the City of Austin through Data Visualization. The workshop included a presentation of my work as well as a question and answer panel.
SXSW Interactive Innovation Lab
The visualization was on display at SXSW in February 2019 and included was an exploration video about the process behind the visualization. The video shows the interactive elements of the visualization and how it was sequenced to deliver an impactful story.
As a takeaway, small flyers were created for interested persons to remember the project.
SEGD Conference
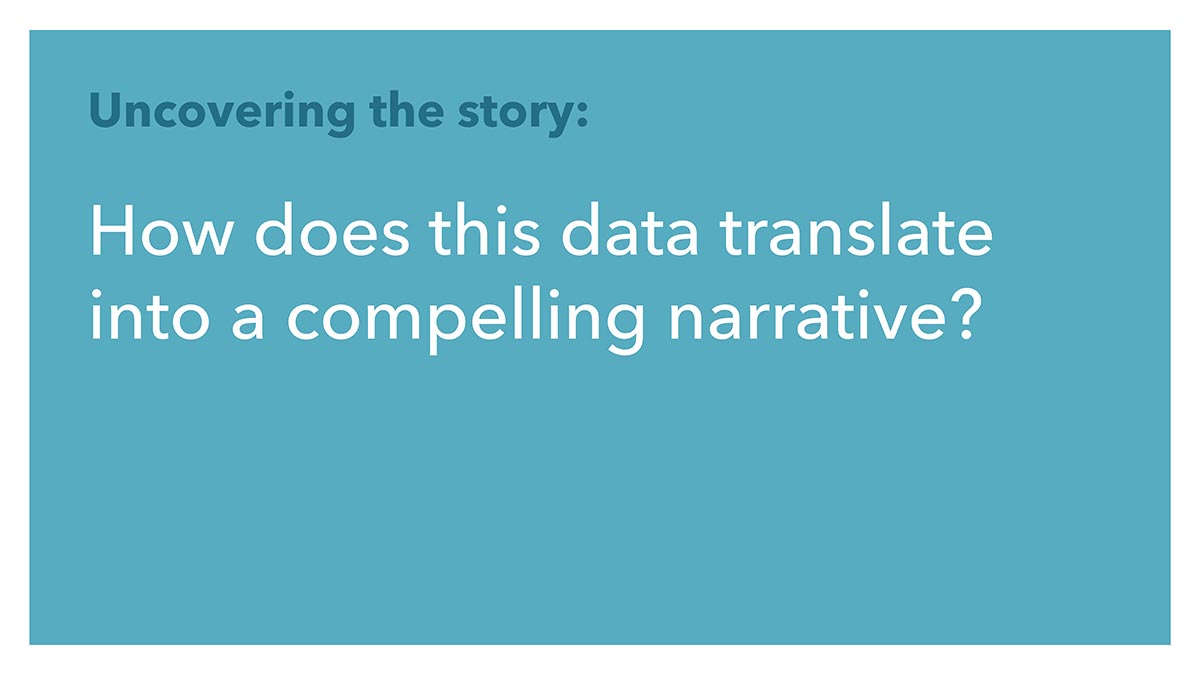
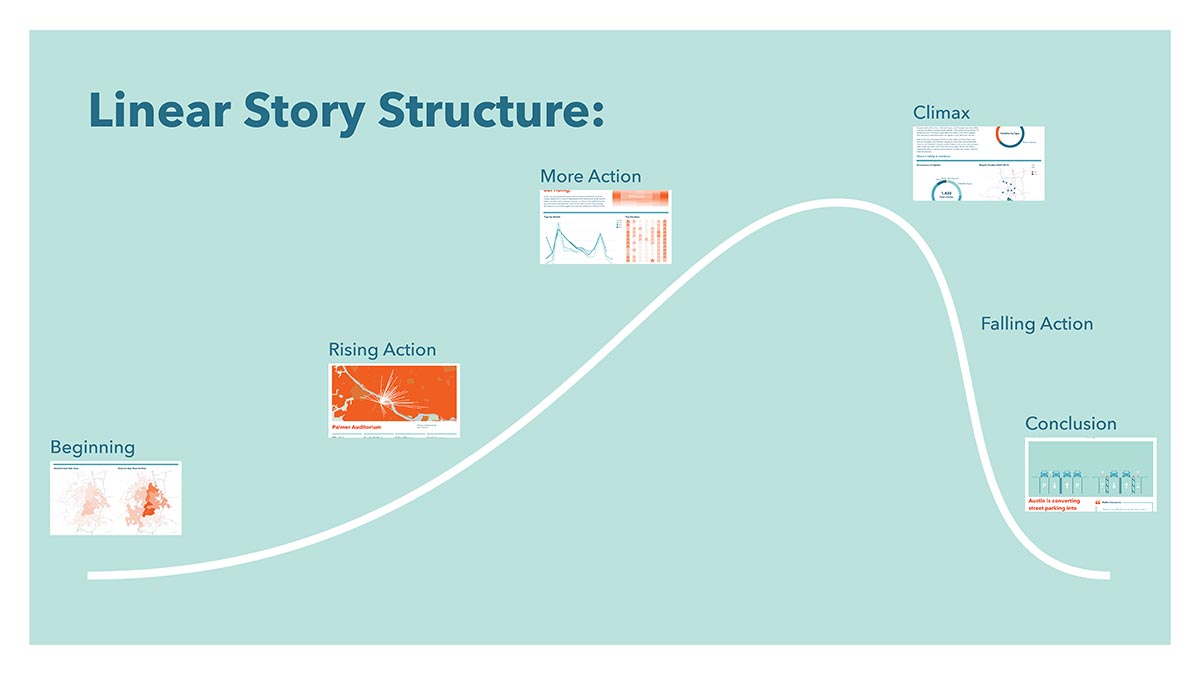
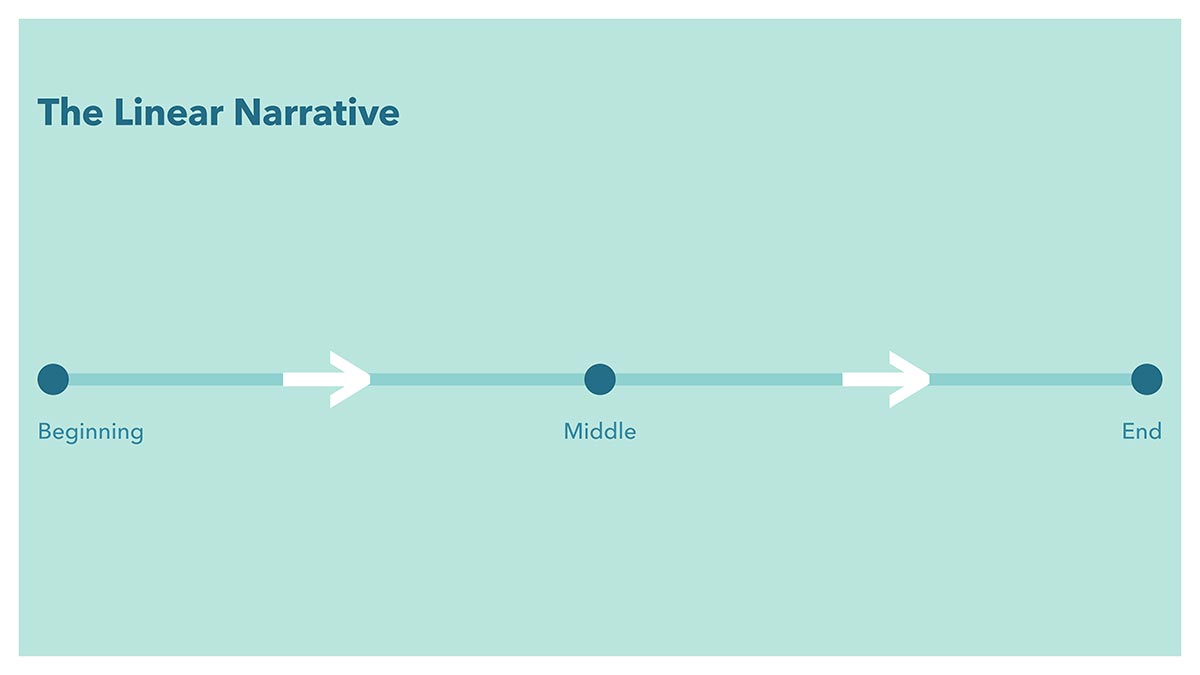
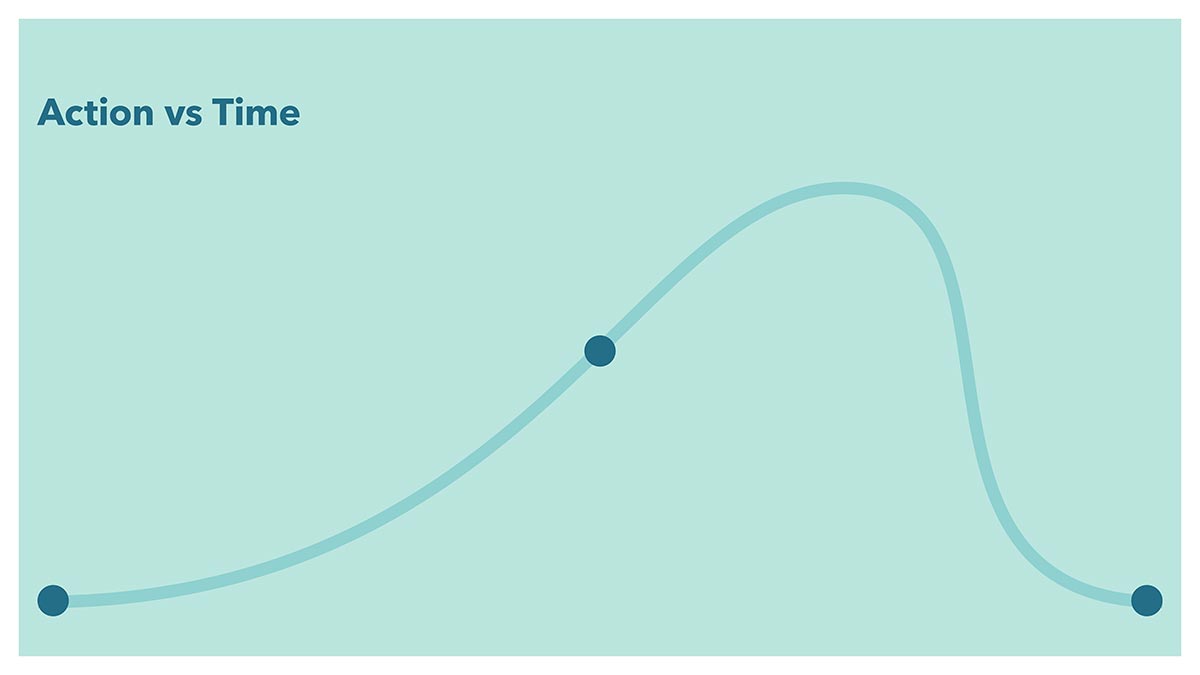
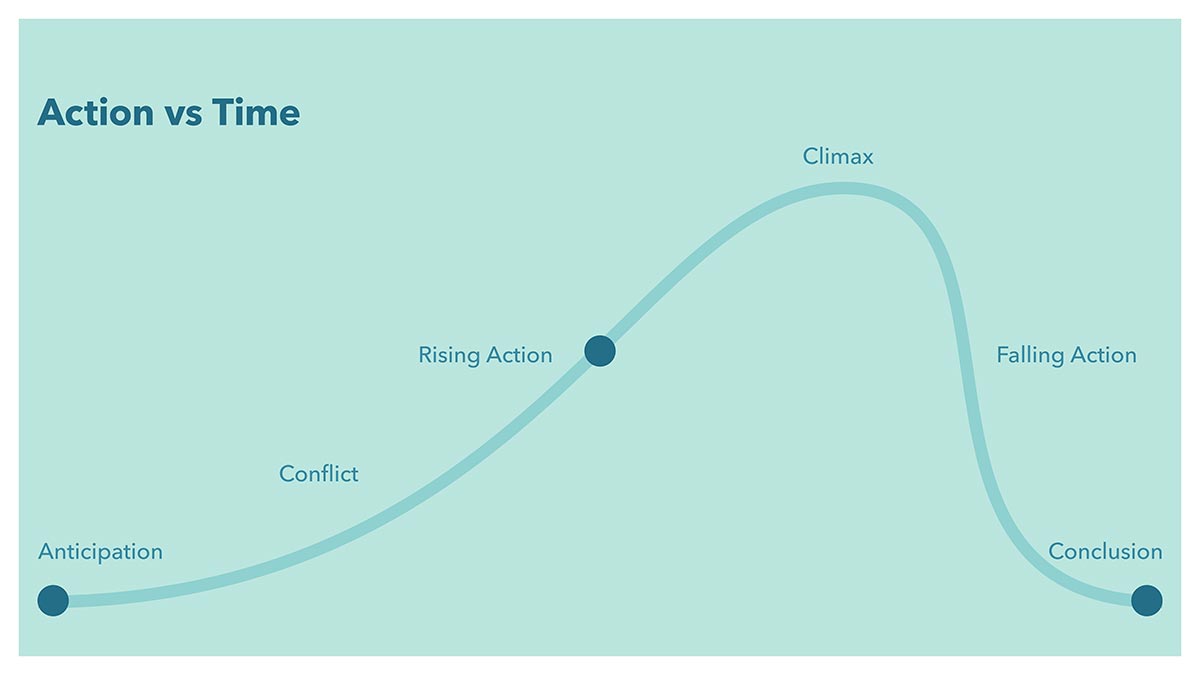
After writing an abstract about my visualization and how it pertains to data-driven narratives, I presented my paper at the summer conference. The slides cover the narrative process and how data can be more effective as a story-telling element than narrative.
You can read the published paper on the SEGD site: Let's Go for a Ride Abstract or on my blog: Let’s Go for a Ride: An Interactive, Data-based Narrative
City Hall Gallery
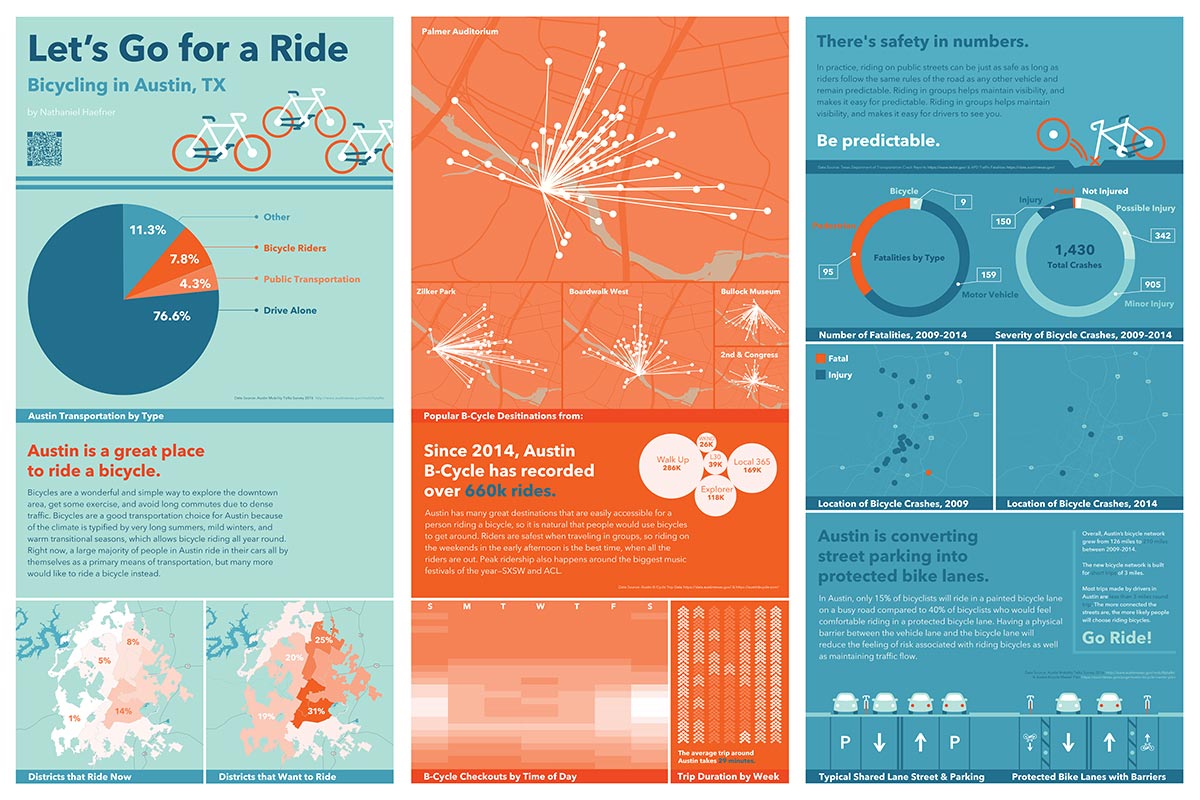
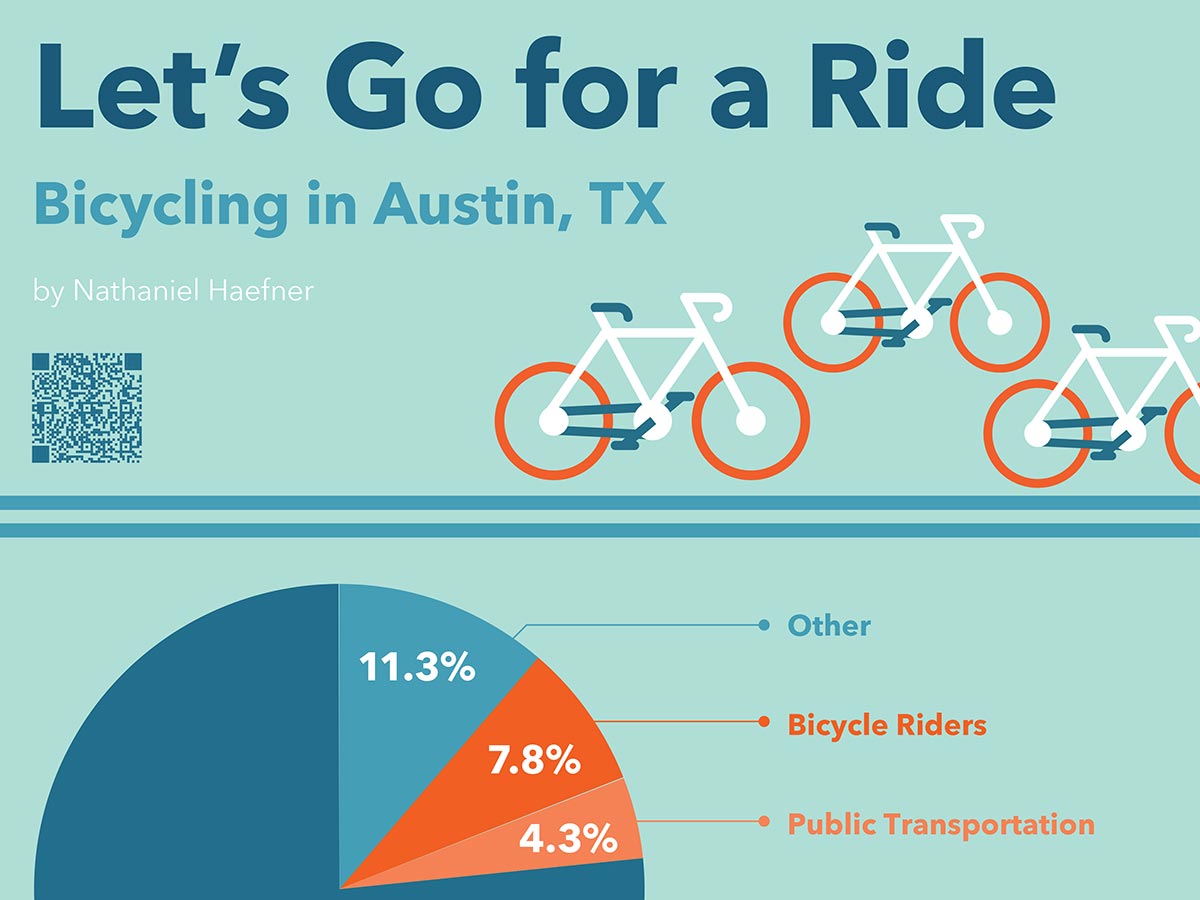
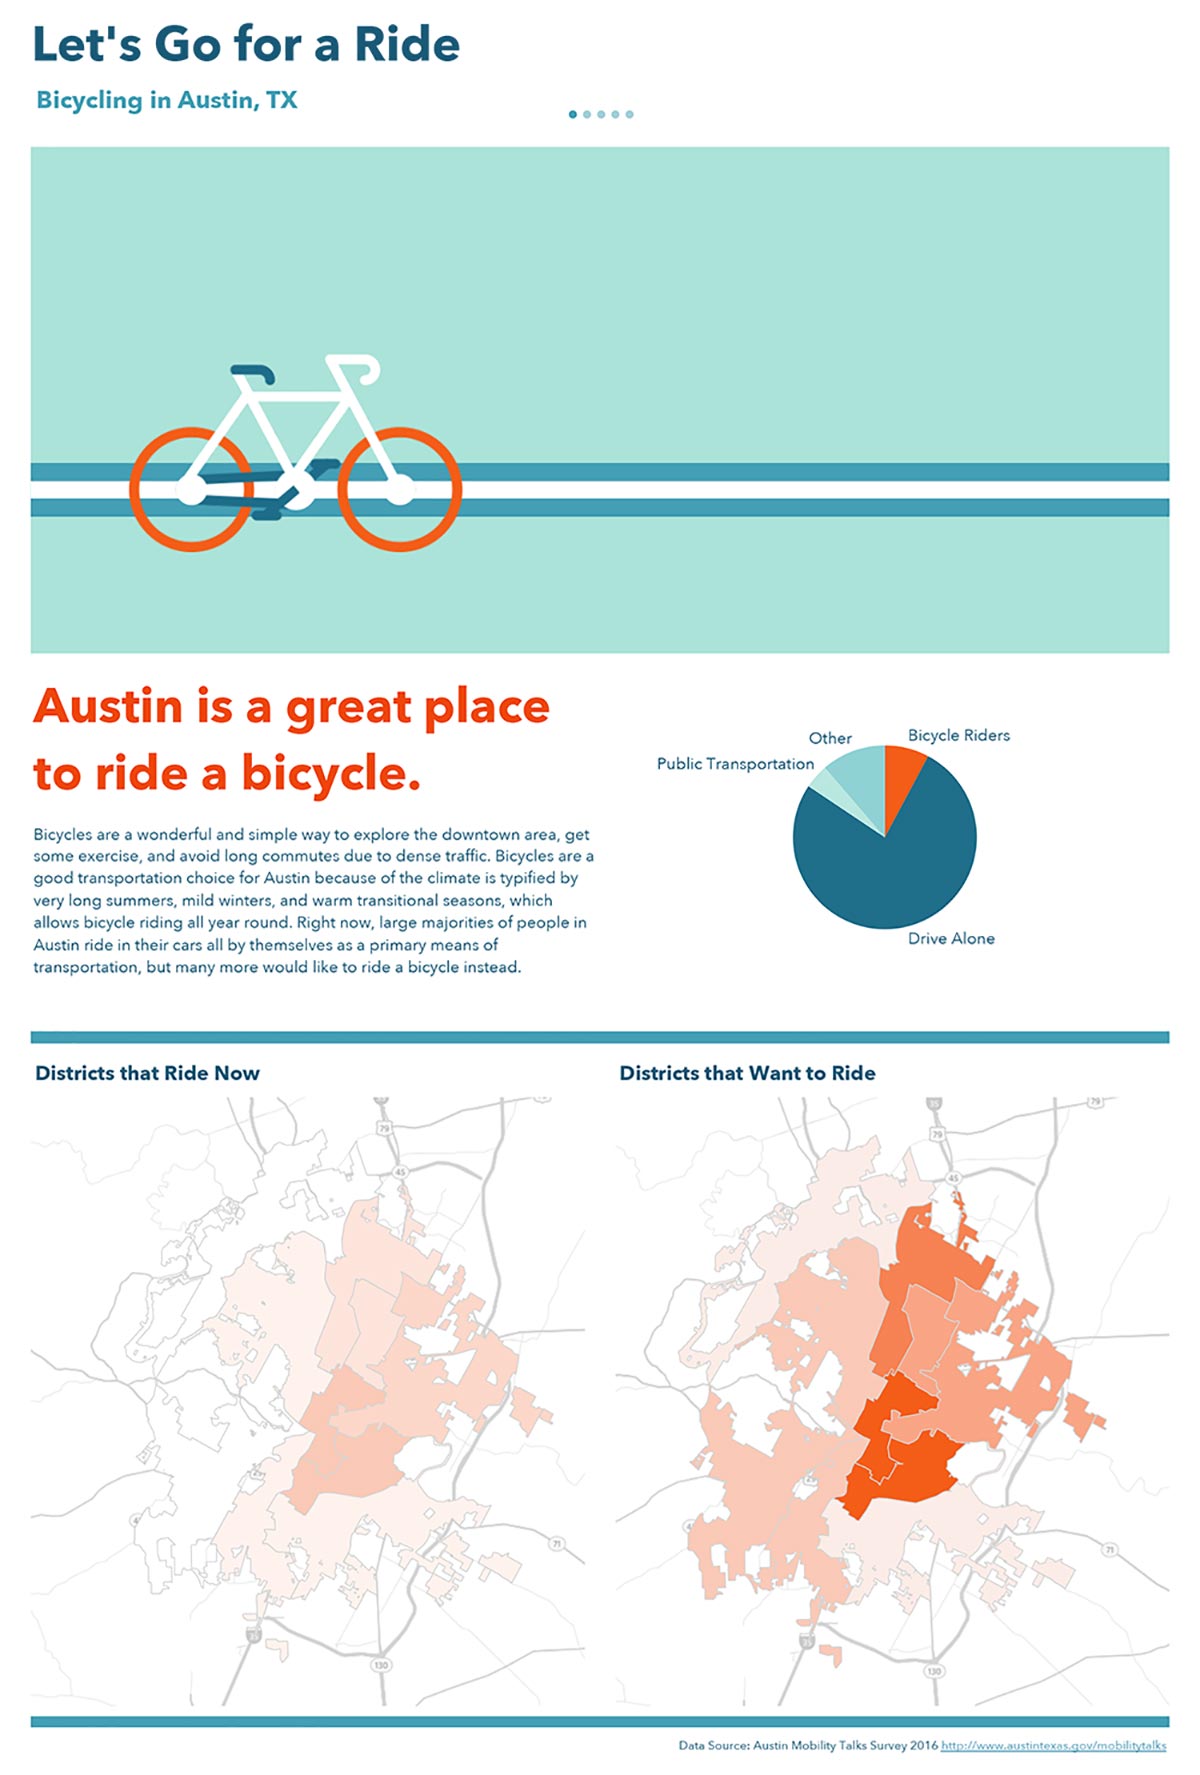
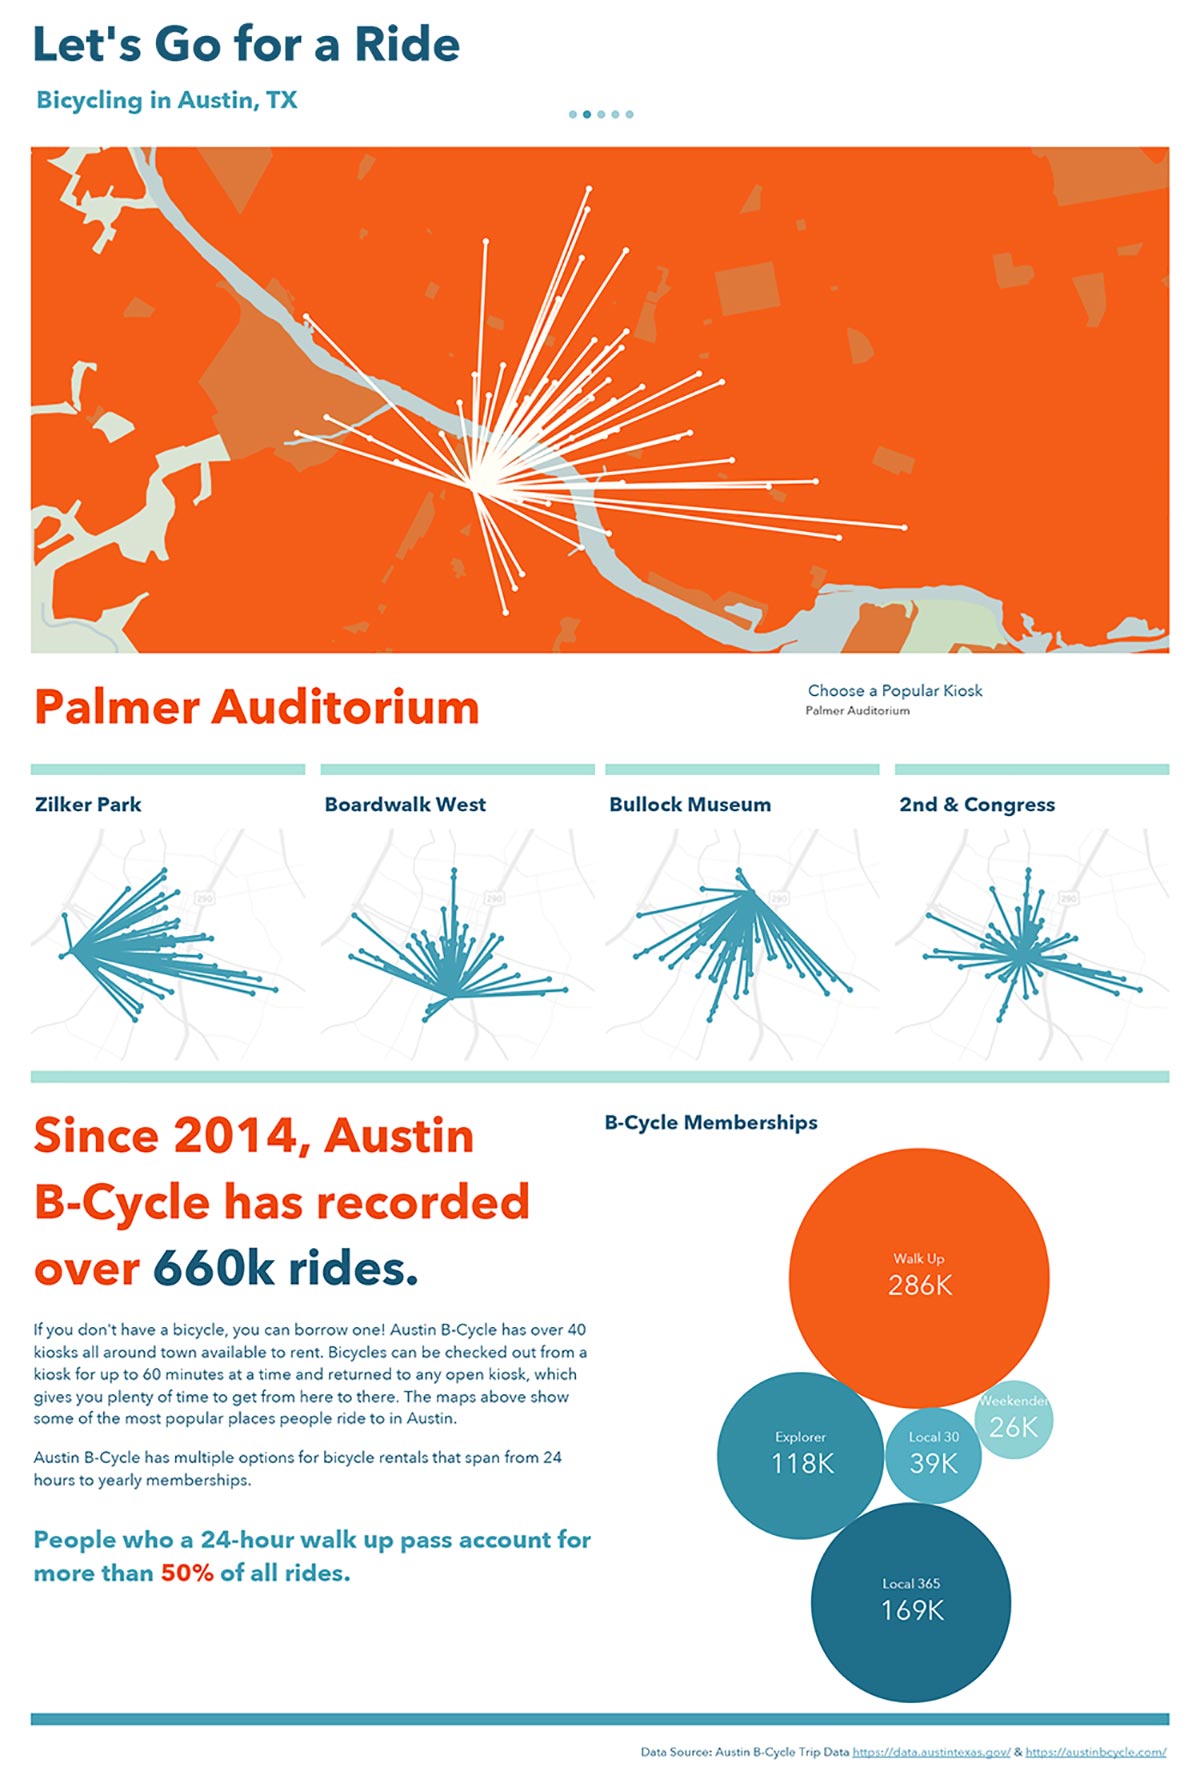
The latest display of Let’s Go for a Ride was a data art poster displayed in Austin City Hall as part of a data art show. This poster was designed to tell the full story.